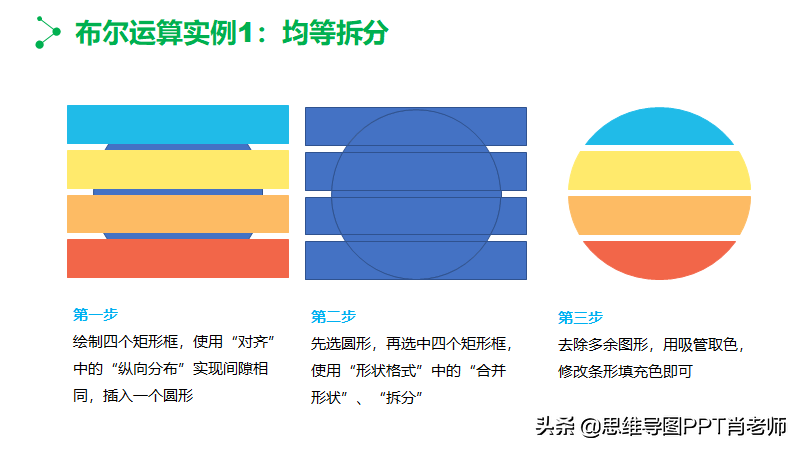
可以使用Python中的PPTX库来自动创建PPT。PPTX是一个Python库,用于创建和更新Microsoft PowerPoint (.pptx)文件。
图片来源于网络
使用PPTX库创建一个包含多个幻灯片、图片、文本框和表格的PPT文件:
from pptx import Presentation

from pptx.util import Inches, Pt

from pptx.enum.text import MSO_ANCHOR, MSO_AUTO_SIZE

from pptx.dml.color import RGBColor

from pptx.enum.shapes import MSO_SHAPE

import pandas as pd

# 创建一个新的PPT文件

prs = Presentation()

# 添加第一个幻灯片

slide1 = prs.slides.add_slide(prs.slide_layouts[0])

title = slide1.shapes.title

title.text = "My Presentation"

subtitle = slide1.placeholders[1]

subtitle.text = "Subtitle"

# 添加第二个幻灯片

slide2 = prs.slides.add_slide(prs.slide_layouts[1])

title = slide2.shapes.title

title.text = "Slide 2"

body = slide2.shapes.placeholders[1].text_frame

p = body.add_paragraph()

p.text = "This is a bullet point"

p.level = 0

p = body.add_paragraph()

p.text = "This is another bullet point"

p.level = 1

# 添加第三个幻灯片

slide3 = prs.slides.add_slide(prs.slide_layouts[2])

title = slide3.shapes.title

title.text = "Slide 3"

subtitle = slide3.placeholders[1]

subtitle.text = "Image Example"

pic = slide3.shapes.add_picture("example.png", Inches(1), Inches(1), Inches(5), Inches(5))

# 添加第四个幻灯片

slide4 = prs.slides.add_slide(prs.slide_layouts[3])

title = slide4.shapes.title

title.text = "Slide 4"

subtitle = slide4.placeholders[1]

subtitle.text = "Table Example"

df = pd.DataFrame({"Name": ["Alice", "Bob", "Charlie"], "Age": [25, 30, 35]})

table = slide4.shapes.add_table(rows=df.shape[0]+1, cols=df.shape[1], left=Inches(1), top=Inches(2), width=Inches(8), height=Inches(0.8))

# 添加表头

for i in range(df.shape[1]):

table.cell(0, i).text = df.columns[i]

# 添加数据

for i in range(df.shape[0]):

for j in range(df.shape[1]):

table.cell(i+1, j).text = str(df.iloc[i, j])

# 添加表格样式

for i in range(table.table.rows.__len__()):

for j in range(table.table.columns.__len__()):

cell = table.table.cell(i, j)

cell.margin_top = Pt(0)

cell.margin_bottom = Pt(0)

cell.margin_left = Pt(0)

cell.margin_right = Pt(0)

if i == 0:

cell.fill.solid()

cell.fill.fore_color.rgb = RGBColor(255, 192, 0)

else:

cell.fill.solid()

cell.fill.fore_color.rgb = RGBColor(255, 255, 255)

for graph in cell.shapes:

if graph.has_text_frame:

text_frame = graph.text_frame

text_frame.vertical_anchor = MSO_ANCHOR.MIDDLE

text_frame.auto_size = MSO_AUTO_SIZE.TEXT_TO_FIT_SHAPE

# 保存PPT文件

prs.save("example.pptx")
该代码创建了一个包含四个幻灯片的PPT文件。第一个幻灯片包含一个标题和副标题,第二个幻灯片包含两个带有项目符号的段落,第三个幻灯片包含一个图片,第四个幻灯片包含一个表格。幻灯片的布局和样式是根据slide_layouts中的预定义布局来设置的。表格的样式是通过设置单元格填充颜色、边距和垂直对齐方式来实现的。
更多操作可以自行探索
图片来源于网络


